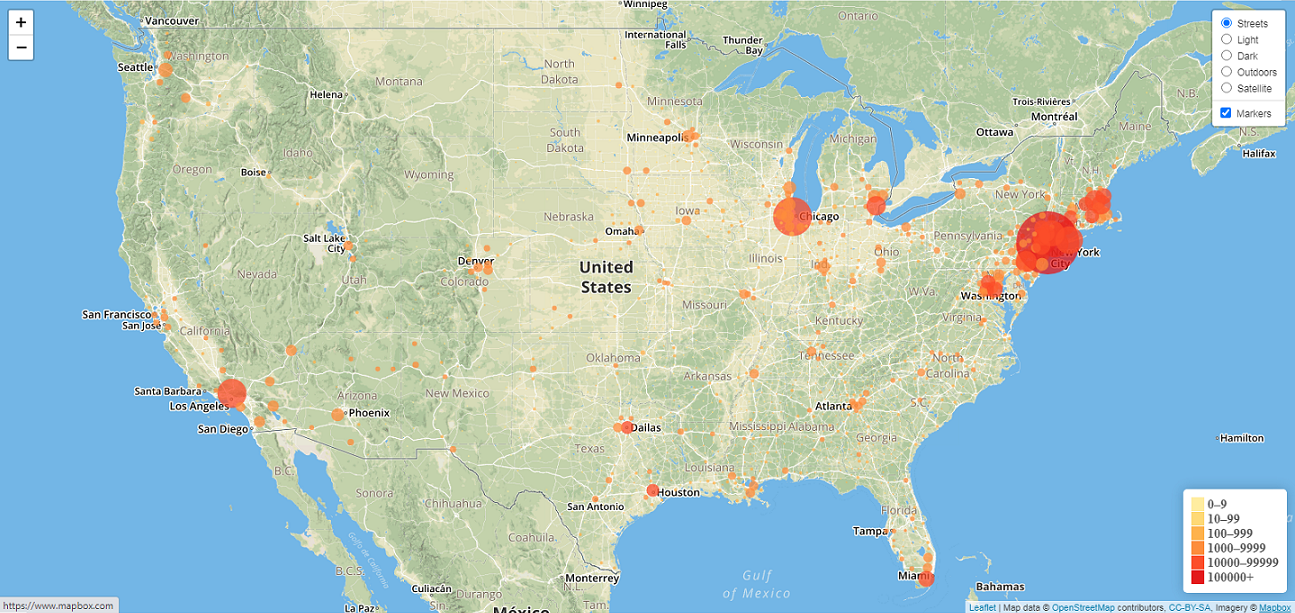
Map of Confirmed Cases Per County
Click on the map for an interactive, up to date map.
This map shows the number of confirmed cases for each county in the United States. Choosing the Dark background map will show the marker circles better, especially for areas that are less affected. A marker circle is displayed for each county with any cases.
Data source: https://opendata.arcgis.com/datasets/628578697fb24d8ea4c32fa0c5ae1843_0.geojson
COVID-19 Cases by Country
Click on the line graph for an up to date graph.
This page shows the number of confirmed cases for each country. There are drop down options to display total cumulative confirmed cases and the number of new cases per day, along with a rolling seven day average of the number of new cases per day.

COVID-19 Cases by State
Click on the line graph for up to date data.
This page shows the COVID-19 data for each state in the United States. There are drop down options to display total cumulative confirmed cases, total deaths, the number of new cases per day, and the number of new deaths per day, along with rolling seven day averages for the last two options. There are also options for displaying the data per 100,000 people.
Data source: https://raw.githubusercontent.com/nytimes/covid-19-data/master/us-states.csv
